Reading Cohort Reports
Overview
Cohort reports track the behavior of a given metric over the life cycle of your customers.
You can use this data to identify trends such as user retention, how long into their subscription customers commonly upgrade or downgrade, and more.
Reading a cohort report
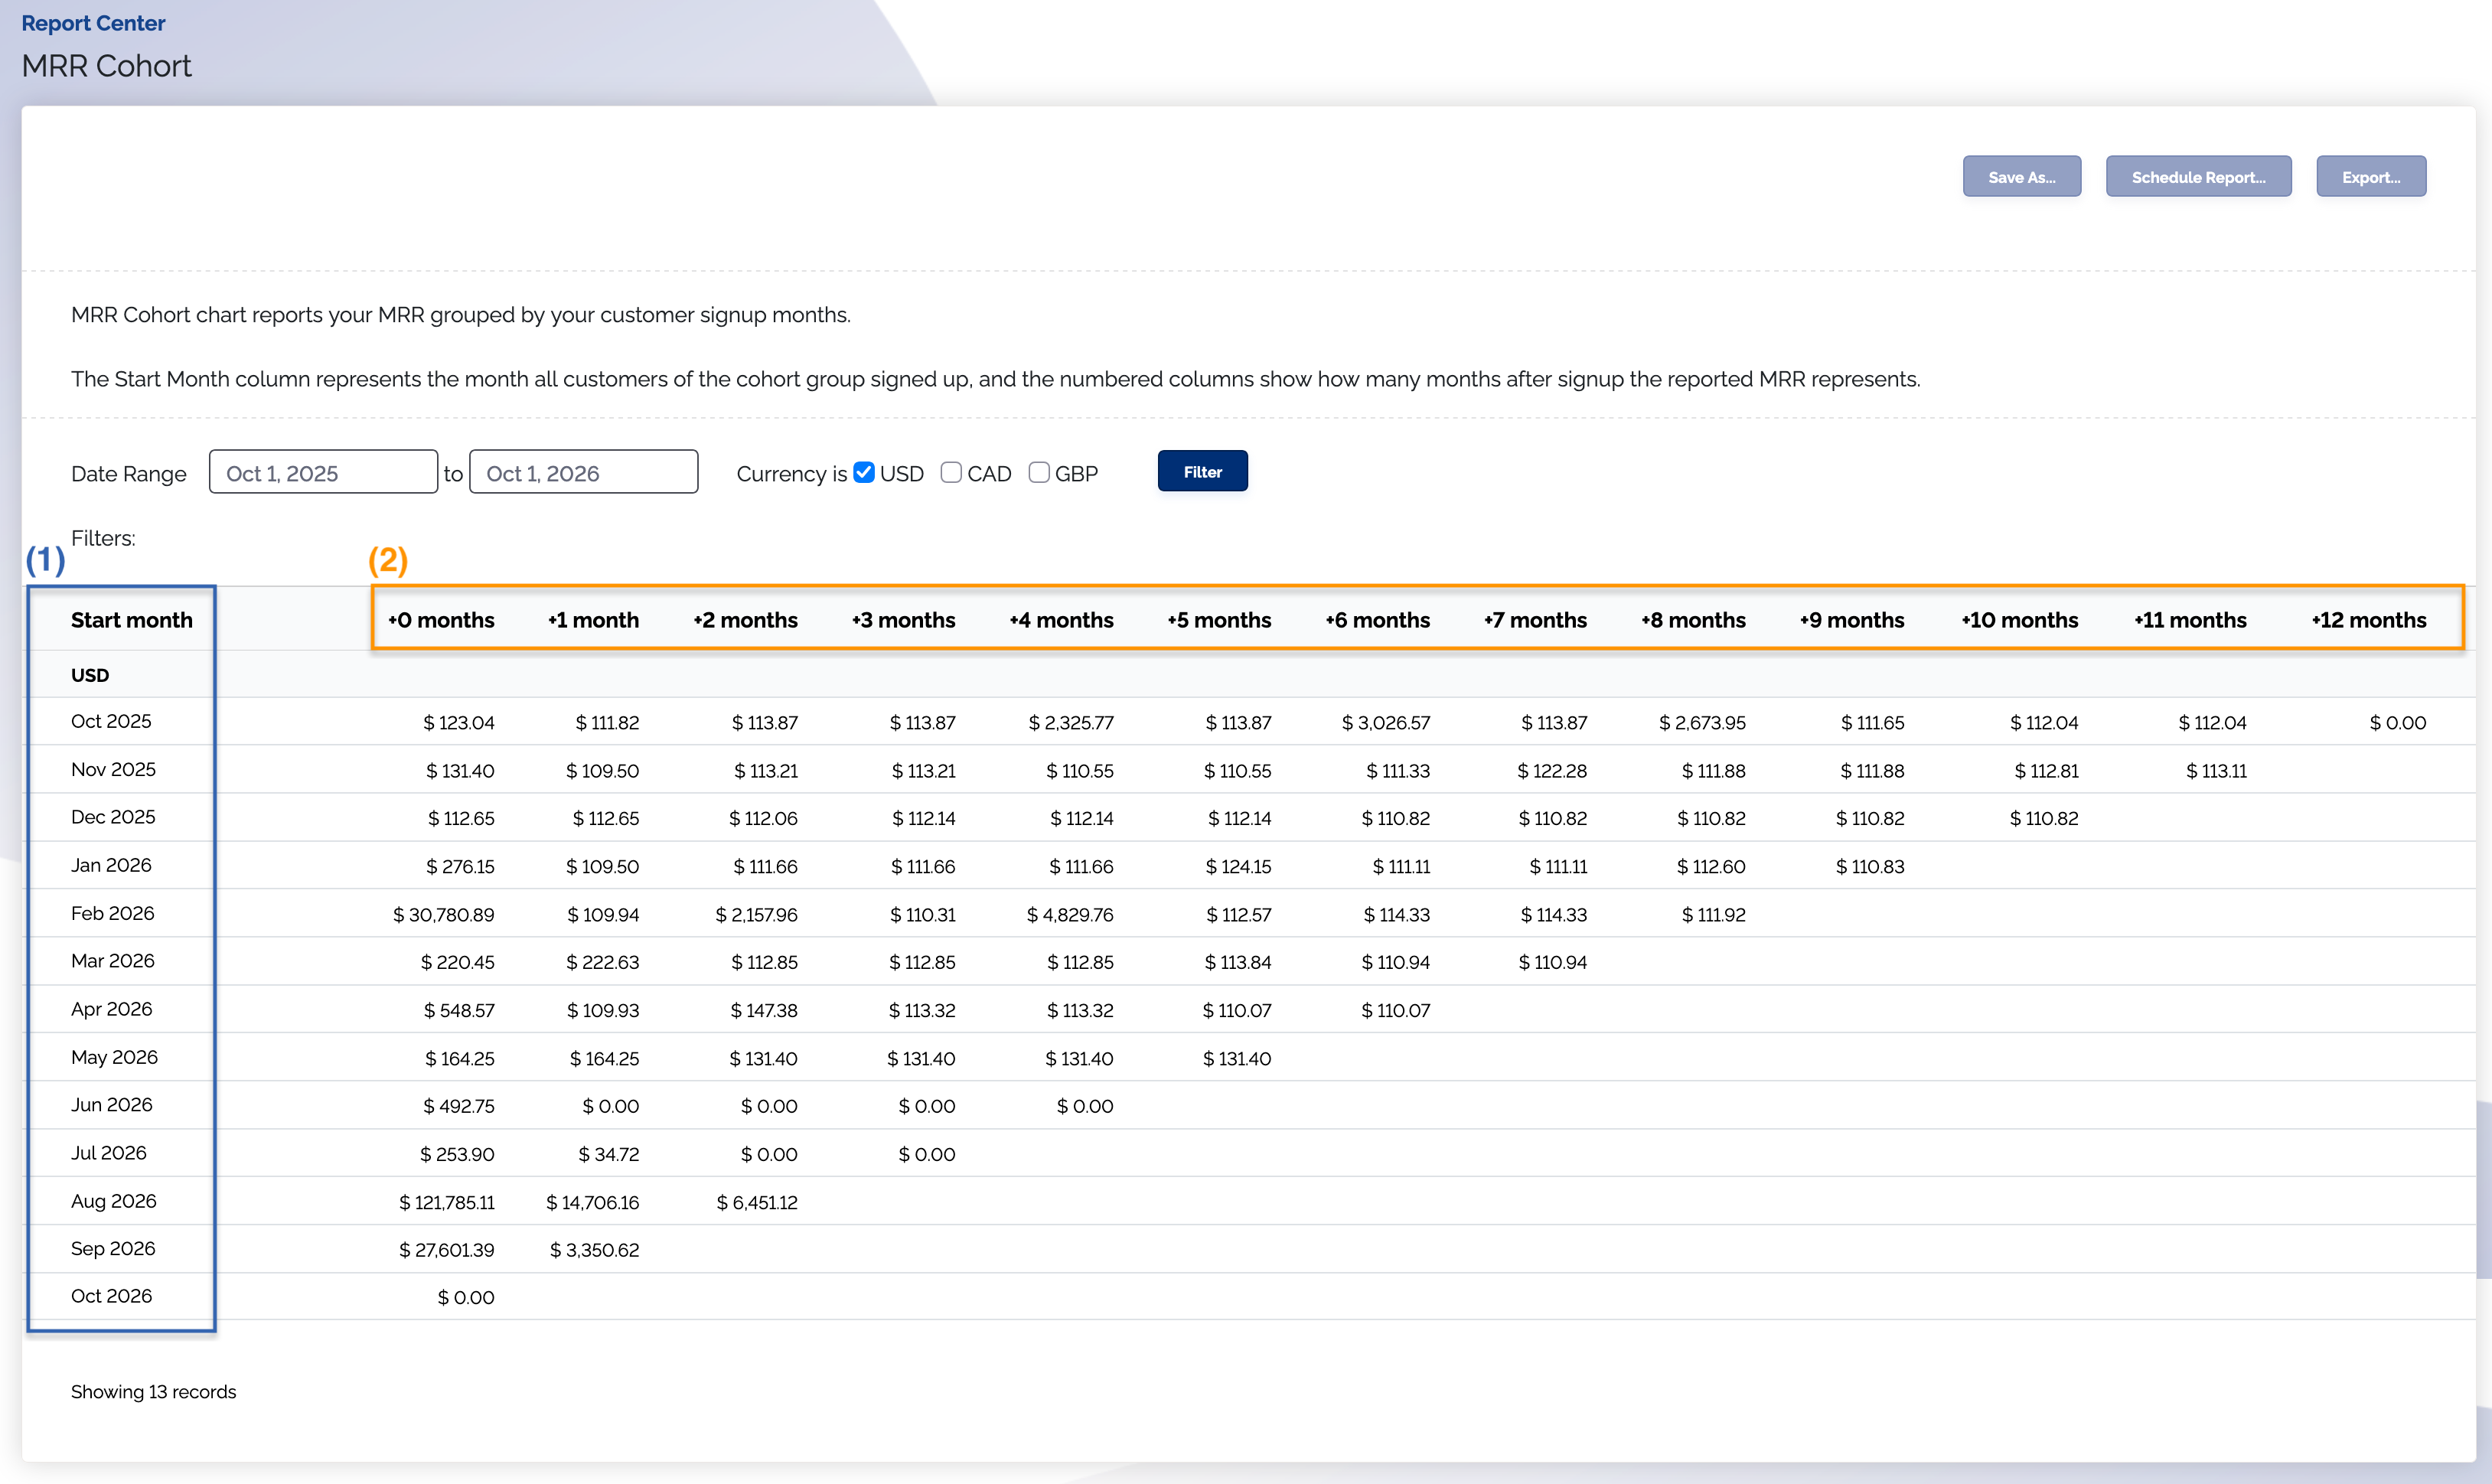
1. Cohort rows
Each row on a cohort report represents the group, or cohort, of customers that signed up that month.
For example, a row with a start month value of October 2025 will contain data for all customers who signed up in October 2025.
2. Cohort columns
Each column on a cohort report represents an offset, in months, of how much time has passed since the starting date.
For example, if a starting date is October 2025, each column will represent months passed since October 2025.
The +0 months column represents October 2025, the +1 months column represents November 2025, and so on, for that row.